| HOW WE ARE HOUSED: RESULTS FROM
THE 1999 AMERICAN HOUSING SURVEY
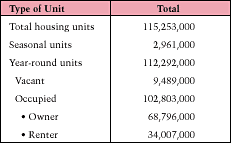
The American Housing Survey (AHS) is invaluable, for it is the only source of detailed information on the Nationĺs housing that is available between the decennial censuses. The 1999 AHS provides a detailed description of the housing stock in the Nation and of the families residing in this housing. The AHS national survey, conducted by HUD and the Bureau of the Census since 1973, is conducted every 2 years. In addition to the national survey, HUD and the Bureau of the Census also conduct the American Housing Survey of Metropolitan Areas, which covers 47 metropolitan areas. The metropolitan area surveys are conducted every 4 to 6 years in the largest metropolitan areas of the country. Both surveys collect information on the entire housing stock, including characteristics of the structure, such as size, number of rooms, plumbing, amenities, housing quality, and household equipment (such as heating); the neighborhood; financing and housing costs; demographics, such as household composition, race/ethnicity, income, migration, and gender of the householder; and occupancy and tenure of the housing unit. The national survey involves telephone interviews or personal visits to approximately 60,000 housing units every 2 years, whereas each metropolitan survey generally involves interviews or visits covering up to 5,000 housing units every 4 to 6 years. A unique and important aspect of the AHS is that the same housing units are revisited during each survey, providing a history of Americaĺs housing. Newly constructed housing units are added each survey year so that the survey continues to represent all housing. Results from the 1999 national survey are now available.1 These data are used as the basis for this article, which presents selected results from the 1999 survey that describe the housing of American families in 1999. This article also explains the many ways to access this rich data source. Selected Information From the 1999 National AHS The composition of the estimated 115 million housing units in the United States is shown in table 1.2 Of these housing units, 2.6 percent are seasonal units and the remaining are meant for year-round use. The vacancy rate in the 112 million housing units meant for year-round use is 8.5 percent. The 103 million occupied, year-round units consist of almost 69 million owner-occupied units and 34 million rental units. Thus, two out of every three households in 1999 owned their own homes. Table 1. Composition of the
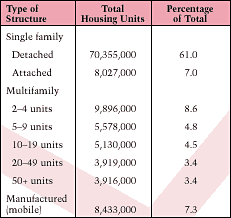
1999 Housing Stock The most common housing structure in the United States is the single-family, detached home, which makes up 61.0 percent of the U.S. housing stock (see table 2). When detached and attached single-family structures (such as townhouses) are counted together, they make up 68.0 percent of the housing stock. Table 2. Percent Distribution
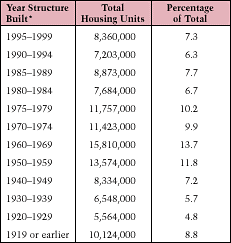
of Housing by Type in the United States Only one out of four housing units (24.7 percent) in the United States is in a multifamily (2+ units) building. Among the 28 million housing units in multifamily structures in the United States, more than one-third (34.8 percent) are in buildings with two to four units, and more than one-half (54.4 percent) are in buildings with only two to nine units. Thus, most residents of units in multifamily build-ings reside in buildings with fewer than 10 units. According to the 1999 AHS, 13.8 percent of housing units in multifamily structures are in buildings with 50 or more units. These 3.9 million units in very large apartment buildings make up only approximately 3.4 percent of all American housing units. Approximately 7.3 percent of the housing units in the United States are manufactured homes (mobile homes or trailers). In 1999, the AHS determined that the stock of American housing is fairly new. More than one-quarter of all housing units (27.9 percent) are less than 20 years old; that is, they were built after 1979. The median age of housing units was 30 years. On the other hand, as seen in table 3, many housing units are very durable and long-lived; more than 10 million housing units (8.8 percent of all units) were built before 1920. More than one-quarter (26.5 per-cent) of the housing units are at least a half-century old; that is, more than one out of four housing units were built prior to 1950. Table 3. Age of U.S. Housing
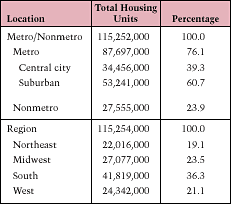
Stock Most American housing is located in metropolitan areas; more than three-fourths (76.1 percent) of the stock of housing units is located in metropolitan areas, leaving about one-fourth (23.9 percent) outside metropolitan areas, according to the 1999 AHS (see table 4). Of the more than 87 million housing units in metropolitan areas, 60.7 percent are in suburbs, and 39.3 percent are in central cities. Table 4. Location of U.S.
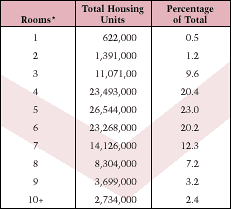
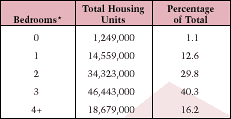
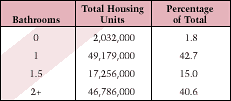
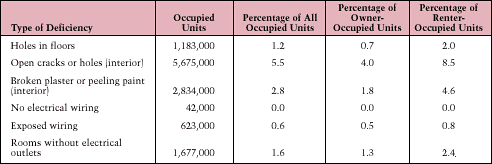
Housing Regionally, more than one-third (36.3 percent) of American housing is in the South, approximately a quarter (23.5 percent) is in the Midwest, approximately one-fifth (21.1 percent) is in the West, and approximately one-fifth (19.1 percent) is in the Northeast. The AHS reveals that the median U.S. housing unit has 5.8 rooms, with more then two-thirds (68.3 percent) of the housing units having five or more rooms. Less then 2 percent of the housing units in the United States have only one or two rooms (see table 5). Table 5. Number of Rooms The AHS found that the typical American housing unit has 3 bedrooms, with more than 65 million housing units (or 56.5 percent of all units) having 3 or more bedrooms. Few housing units (1.1 percent) have no bedrooms (see table 6). Table 6. Number of Bedrooms Almost all U.S. homes (98.2 percent) have one or more complete bathrooms, according to the AHS. Approximately 47 million homes (40.6 percent) have 2 or more bathrooms (see table 7). The 1999 AHS asked respondents about certain physical deficiencies in their housing units. The findings from the latest survey of housing units in the United States show that these housing deficiencies occur at a higher rate in rental housing than in owner-occupied housing. Information on selected deficiencies in occupied housing units in the United States is shown in table 8. Problems such as exposed wiring and lack of electrical wiring are almost absent in the stock of occupied housing (less than 1 percent of the units have these problems). Holes in floors and rooms without electrical outlets also occur infrequently, in only 1 to 2 percent of the units. Broken plaster or peeling paint occurs in 2.8 percent of the housing stock. Open cracks or holes inside homes are the most commonly occurring physical deficiency, and these occur in only 5.5 percent of U.S. housing units (see table 8). Table 8. Selected Housing
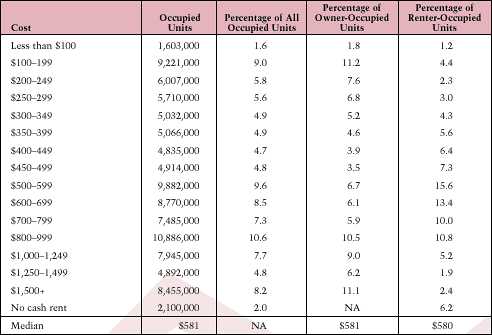
Deficiencies The likelihood of physical deficiencies is lower in owner-occupied housing than in rental housing. The proportion of units with holes in floors, open cracks or holes in the interior, or broken plaster or peeling paint in the interior in the rental housing stock is more than twice the proportion in the stock of owner-occupied housing with the same deficiency. While 4.0 percent of the stock of owner-occupied housing has open cracks or holes in the interior, the proportion with this deficiency in the rental stock is 8.5 percent; and while 1.8 percent of the owner-occupied stock has broken plaster or peeling paint in the interior, 4.6 percent of the rental stock has this deficiency. Although rental housing has relatively higher proportions of deficiencies than does owner-occupied housing, the levels of physical deficiencies in rental housing remain low. For example, even the most frequently occurring physical deficiency, open cracks or holes in the interior, occurs in only 8.5 percent of the rental units in the United States. The 1999 AHS found that Americans had median monthly housing costs of $581. Approximately one out of every five households (or 20.7 percent of the households) spent $1,000 or more per month on housing. On the other hand, 21.9 percent had monthly costs of less than $300 (see table 9). Table 9. Monthly Housing Costs Housing cost for owners includes mortgage payments, taxes, utilities, insurance, and certain fees; for renters, it includes rental payments, utilities, renter insurance, and mobile home park fees, where applicable. The median monthly housing costs for owners and for renters were almost the sameŚapproximately $580. Among homeowners, more than 1 out of 4 spent $1,000 or more on housing per month; less than 1 out of 10 renters had such high housing costs. More than 2 out of 10 homeowners paid less than $300 per month in housing costs, while approximately 1 out of 10 renters had monthly housing costs that were less than $300. Across regions, the median housing costs are the highest in the West ($697), followed by the Northeast ($658). Median housing costs are lower in the Midwest ($521) and the South ($516). In terms of income, the typical household spent approximately 19 percent of its income on housing. This figure was different for owners versus rentersŚowners paid a median of 17 percent of their income on housing, while renters paid 27 percent of their income on housing. The preceding discussion only touches on the wealth of information available in the AHS about American families and their housing. In addition to tables on all housing units and all occupied units, the AHS report has separate tables for units occupied by owners; renters; and African-American, Hispanic, and elderly households. These tables in the AHS report allow you to look beyond the overall figures to see how different groups fare. For example, on the issue of physical deficiencies, it was noted earlier that open cracks or holes in the interior of the house were found in 5.5 percent of all housing units. The more detailed tables show that 9.1 percent of the homes of African-American households, 7.9 percent of the homes of Hispanic households, 9.1 percent of the homes of households in poverty, and 2.9 percent of the homes of elderly households have open cracks or holes in the interior. In addition to the published AHS tables, a researcher can use the publicly available AHS data files to prepare customized tables for various income groups, regions, household types, tenure types, and structural types. The detailed AHS tables allow ready comparisons across different household groups. For example, the data in chapter 7, Occupied Units with Elderly Householder, allow you to compare the 21,423,000 elderly households with all households and highlight differences such as the following:
This article presents only some of the information available in the latest AHS report. The report (available in hard copy or as a downloadable PDF document) contains approximately 500 pages of tables that cover general housing characteristics, building and housing unit size, plumbing, equipment, fuels, problems with equipment, neighborhood conditions, occupant family types and composition, recent movers, income and housing costs, and value and financing. The next section discusses the many ways to tap into this rich and extensive source of information. Accessing Housing Information HUD and the Bureau of the Census have given high priority to making the AHS accessible. The AHS information is made available in tabular and microdata formats. A full array of media is used; the tabulations are available in hard copy, PDF, CD-ROM, and downloadable Internet files, and the microdata files (in ASCII or SAS formats) are available on CD-ROM or can be downloaded from the Internet. Copies of the printed versions are available from HUD USER (1ľ800ľ245ľ2691). The national AHS reports can be bought from the Government Printing Office (202ľ512ľ1800), and the metropolitan area reports can be obtained from the Bureau of the Census (301ľ457ľ4100). Both the Bureau and HUD maintain Internet sites, and HUD operates an AHS listserv for the AHS user community. The HUD Web site for the AHS is www.huduser.gov/datasets/ahs.html. At this site, you will find:
The Bureauĺs Web site for the AHS is www.census.gov/hhes/www/ahs.html. This site provides:
HUD operates an Internet mailing list to provide information and to create a forum for exchange of information within the AHS user community. To subscribe, send a message to helpdesk@huduser.gov. In the body of the e-mail, type, ôsubscribe AHS [your first and last name].ö Stay Tuned: More To Come HUD is documenting the effects of the changes in survey methods that took place in 1997. We are also working on an improved codebook for the revised survey. The next national survey will be in 2001, and work has already begun on the questionnaire. The mortgage module is being revised to reflect the increasing popularity of home equity loans, and a few questions are being added to the neighborhood module to identify gated communities. A set of questions on citizenship and immigration status of the householder is being added to the survey. HUD has also commissioned a study of how the AHS metropolitan areas data are being used. The final report of that study should be available shortly after this issue of U.S. Housing Market Conditions goes to press. Notes 1. U.S. Department of Housing and Urban Development and the Bureau of the Census, American Housing Survey for the United States: 1999, Current Housing Reports, Series H150/99, U.S. Government Printing Office, Washington, DC, forthcoming. 2. All data presented in this article are based on a representative probability sample and are subject to sampling error. Nonsampling error is also present. An appendix to the AHS report contains more details on survey error. |