|
HOUSING
PRODUCTION
 Permits* Permits*
Permits for construction of new housing units were unchanged in
the second quarter of 1997 at a seasonally adjusted annual rate
of 1,423,000 units and were 2 percent below the second quarter
of 1996. One-unit permits, at 1,053,000 units, were unchanged
from the level of the previous quarter but down 5 percent from
a year earlier. Multifamily permits (5 or more units in structure),
at 302,000 units, were 3 percent below the first quarter but 7
percent above the second quarter of 1996.
 *Components may not add to totals because of rounding. Units in thousands.
**This change is not statistically significant.
Source: Bureau of the Census, Department of Commerce
 Starts* Starts*
Construction starts of new housing units in the second quarter
of 1997 totalled 1,440,000 units at a seasonally adjusted annual
rate, a statistically insignificant 2 percent below the first
quarter of 1997 and 4 percent below the second quarter of 1996.
Single-family starts, at 1,108,000 units, were 5 percent lower
than the previous quarter and 7 percent below the 1996 rate. Multifamily
starts totalled 293,000 units, 14 percent above the previous quarter
and 15 percent above the same quarter in 1996.
 *Components may not add to totals because of rounding. Units in thousands.
**This change is not statistically significant.
Source: Bureau of the Census, Department of Commerce
 Under Construction* Under Construction*
Housing units under construction at the end of the second quarter
of 1997 were at a seasonally adjusted annual rate of 823,000 units,
equal to the previous quarter and even with the second quarter
of 1996. Single-family units stood at 567,000, a statistically
insignificant 1 percent above the previous quarter but 5 percent
below the second quarter of 1996. Multifamily units were at 232,000
units, up a statistically insignificant 5 percent from the previous
quarter and up 12 percent from the second quarter of 1996.
 *Components may not add to totals because of rounding. Units in thousands.
**This change is not statistically significant.
Sources: Bureau of the Census, Department of Commerce, and Office of Policy Development and Research, Department of Housing and Urban Development
 Completions* Completions*
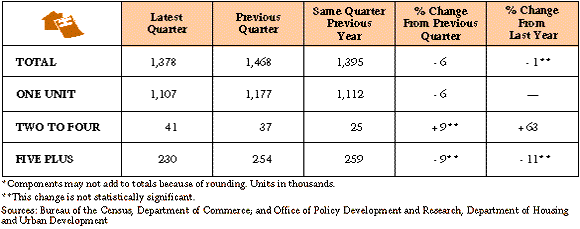
Housing units completed in the second quarter of at a seasonally
adjusted annual rate of 1,378,000 units were down 6 percent from
the previous quarter and a statistically insignificant 1 percent
from the same quarter of 1996. Single-family completions at 1,107,000
units were down 6 percent from the previous quarter and unchanged
from the rate of a year earlier. Multifamily completions at 230,000
units were a statistically insignificant 9 percent below the previous
quarter and a statistically insignificant 11 percent below the
same quarter of 1996.
 Manufactured (Mobile) Home Shipments* Manufactured (Mobile) Home Shipments*
Shipments of new manufactured (mobile) homes were at a seasonally
adjusted annual rate of 349,000 units in the first quarter of
1997, which is 1 percent below the previous quarter and 2 percent
below the rate of the same quarter a year earlier.
 * Units in thousands. These are HUD-code homes only and do not include manufactured housing units built to meet local building codes, which are included in housing starts figures.
Source: National Conference of States on Building Codes and Standards
HOUSING MARKETING
 Home Sales* Home Sales*
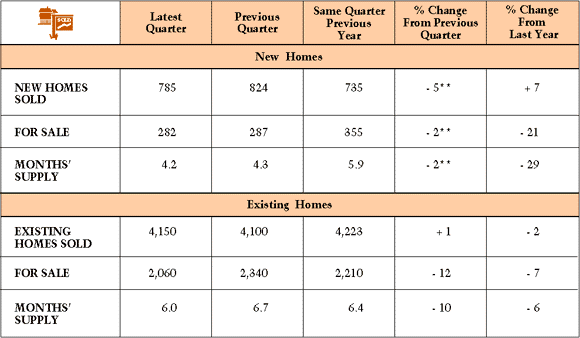
Sales of new single-family homes totalled 785,000 units at a seasonally
adjusted annual rate (SAAR) in the second quarter of 1997, a statistically
insignificant 5 percent below the previous quarter and 7 percent
above the second quarter of 1996. The number of new homes for
sale at the end of June 1997 numbered 282,000 units, down a statistically
insignificant 2 percent from the last quarter and down 21 percent
from the second quarter of 1996. At the end of June, inventories
represented a 4.2 months' supply at the current sales rates,
down a statistically insignificant 2 percent from the previous
quarter and down 29 percent from the second quarter of 1996.
Sales of existing single-family homes for the second quarter of
1997 reported by the NATIONAL ASSOCIATION OF REALTORS® totalled
4,150,000 (SAAR), up 1 percent from the first quarter's
level but down 2 percent from the second quarter of 1996. The
number of units for sale at the end of the second quarter was
2,060,000, 12 percent below the previous quarter and 7 percent
below the second quarter of 1996. At the end of the second quarter,
a 6.0 months' supply of units remained, 10 percent below
the previous quarter and 6 percent below the second quarter of
1996.
 *Units in thousands.
**This change is not statistically significant.
Sources: New: Bureau of the Census, Department of Commerce; and Office of Policy Development and Research, Department of Housing and Urban Development
Existing: NATIONAL ASSOCIATION OF REALTORS®
 Home Prices Home Prices
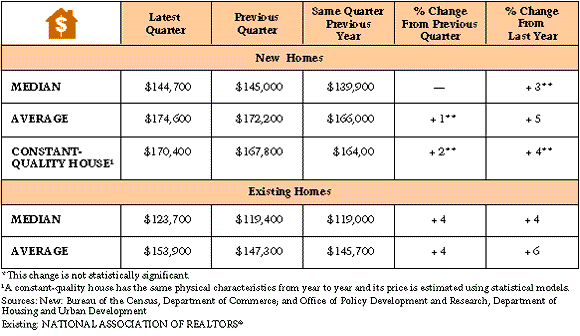
The median price of new homes during the second quarter of 1997
was $144,700, equal to the previous quarter's level and
up a statistically insignificant 3 percent from the second quarter
of 1996. The average price of new homes sold during the second
quarter of 1997 was $174,600, up a statistically insignificant
1 percent from the first quarter of 1997 and up a statistically
insignificant 5 percent from the same quarter a year ago. The
price adjusted to represent a constant-quality house was $170,400,
a statistically insignificant 2 percent above the first quarter
of 1997 and up a statistically insignificant 4 percent from the
second quarter of 1996. The values for the set of physical characteristics
used for the constant-quality house are based on 1992 sales.
The median price of existing single-family homes in the second
quarter of 1997 was $123,700, 4 percent above last quarter and
4 percent above the second quarter of 1996, according to the NATIONAL
ASSOCIATION OF REALTORS®. The average price of $153,900 was
4 percent above the previous quarter and 6 percent above the second
quarter of 1996.
 Housing Affordability Housing Affordability
Housing affordability is the ratio of median family income to
the income needed to purchase the median-priced home based on
current interest rates and underwriting standards, expressed as
an index. The NATIONAL ASSOCIATION OF REALTORS® composite
index value for the second quarter of 1997 shows that families
earning the median income have 125.2 percent of the income needed
to purchase the median-priced existing home. This figure is 4
percent below the first quarter of 1997 and equal to the second
quarter of 1996. This decrease is the result of a 4-percent increase
in the median home price and a 17-basis-point increase in the
interest rate, more than offsetting a 1-percent rise in median
family income during the last quarter. The fixed-rate index fell
4 percent from the first quarter of 1997 but was unchanged from
the second quarter of 1996. The adjustable-rate index decreased
by 3 percent from the previous quarter but increased by 1 percent
from the same quarter a year earlier.

 Apartment Absorptions Apartment Absorptions
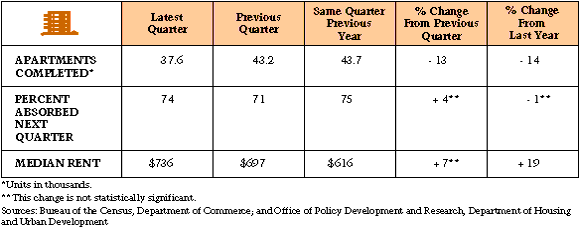
There were 37,600 new, unsubsidized, unfurnished, multifamily
(5 or more units in structure) rental apartments completed in
the first quarter of 1997, down 13 percent from the previous quarter
and 14 percent from the first quarter of 1996. Of the apartments
completed in the first quarter of 1997, 74 percent were rented
within 3 months. This absorption rate is a statistically insignificant
4 percent above the previous quarter but a statistically insignificant 1 percent below the same quarter the previous year. The median asking rent for apartments completed
in the fourth quarter was $736, which is a statistically insignificant
7 percent above the previous quarter and 19 percent higher than a year earlier.
 Manufactured (Mobile) Home Placements Manufactured (Mobile) Home Placements
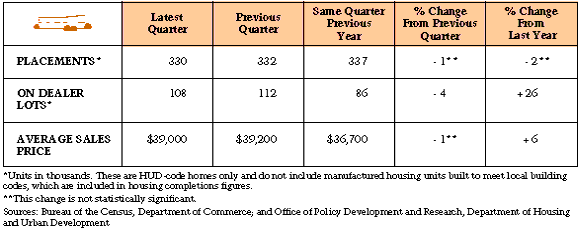
Manufactured homes placed on site ready for occupancy in the first
quarter of 1997 totalled 330,000 at a seasonally adjusted annual
rate, 1 percent below the level of the previous quarter and 2
percent below the fourth quarter of 1996. (Both changes are statistically
insignificant.) The number of homes for sale on dealers'
lots at the end of the first quarter totalled 108,000 units, 4
percent below the previous quarter but 26 percent above the same quarter of 1996. The average sales price of the units sold in the first quarter was $39,000, a statistically insignificant
1 percent below the previous quarter and 6 percent above the first-quarter
1996 price.
 Builders' Views of Housing Market Activity Builders' Views of Housing Market Activity
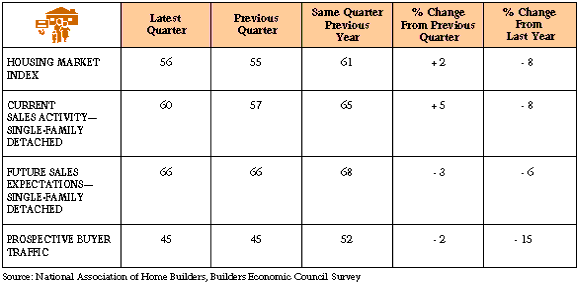
The National Association of Home Builders (NAHB) conducts a monthly
survey focusing on builders' views of the level of sales
activity and their expectations for the near future. NAHB uses
these survey responses to construct indices of housing market
activity. (The index values range from 0 to 100.) The second-quarter
value for the index of current market activity for single-family
detached houses stood at 60, up 3 points from the first quarter
but down 5 points from 1996's second quarter. The index
for future sales expectations, 64, was down 2 points from the
first-quarter value and 4 points from 1996's level. Prospective
buyer traffic had an index value of 44, which is 1 point below
the first-quarter value and 8 points below 1996's second-quarter
level. NAHB combines these separate indices into a single housing
market index that mirrors the three components quite closely.
In the second quarter, this index stood at 56, which is 1 point
above the first-quarter level but 5 points below the value from
1996.
HOUSING
FINANCE
 Mortgage Interest Rates Mortgage Interest Rates
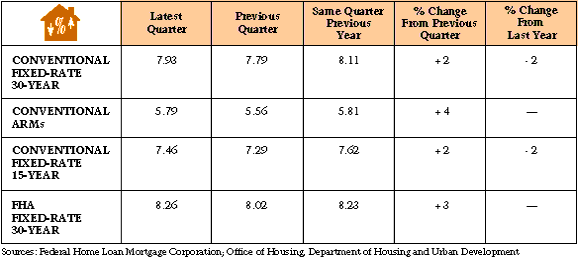
Mortgage interest rates for all categories of loans increased
slightly from the previous quarter. The contract mortgage interest
rate for 30-year, fixed-rate, conventional mortgages reported
by Freddie Mac was 7.93 percent in the second quarter of 1997,
14 basis points higher than the previous quarter but 18 basis
points lower than the same quarter of 1996. Adjustable-rate mortgages
in the second quarter were going for 5.79 percent, 23 basis points
above the previous quarter and 2 basis points below the same quarter
of 1996. Fixed-rate, 15-year mortgages, at 7.46 percent, were
up 17 basis points from last quarter but down 16 basis points
from the same quarter of the previous year. The FHA rate increased
24 basis points during the quarter and was 3 basis points above
the same quarter in 1996. It should be noted that we are reporting
the average interest rate quote for the FHA series rather than
the most active quote.
 FHA 1-4 Family Mortgage Insurance* FHA 1-4 Family Mortgage Insurance*
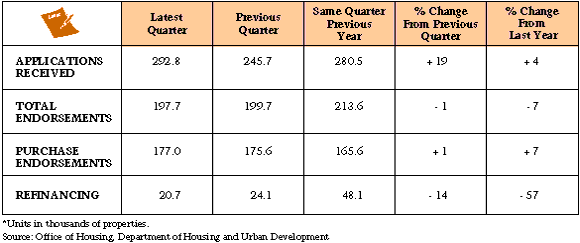
Applications for FHA mortgage insurance on 1-4 family homes
were received for 292,800 (not seasonally adjusted) properties
in the second quarter of 1997, up 19 percent from the previous
quarter and up 4 percent from the second quarter of 1996. Endorsements
or insurance policies issued totalled 197,700, down 1 percent
from the first quarter of 1997 and down 7 percent from the second
quarter of 1996. Endorsements for refinancing were 20,700, down
14 percent from the first quarter of 1997 and down 57 percent
from a year earlier.
 PMI and VA Activity* PMI and VA Activity*
Private mortgage insurers issued 235,000 policies or certificates
of insurance on conventional mortgage loans during the second
quarter of 1997, up 15 percent from the first quarter and down
21 percent from the second quarter of 1996; these numbers are
not seasonally adjusted. The U.S. Department of Veterans Affairs
reported the issuance of mortgage loan guaranties for 59,000 single-family
properties in the second quarter of 1997, down 7 percent from
the previous quarter and down 36 percent from the second quarter
of 1996.

 Mortgage Originations by Loan Type, 1-4 Family Units Mortgage Originations by Loan Type, 1-4 Family Units
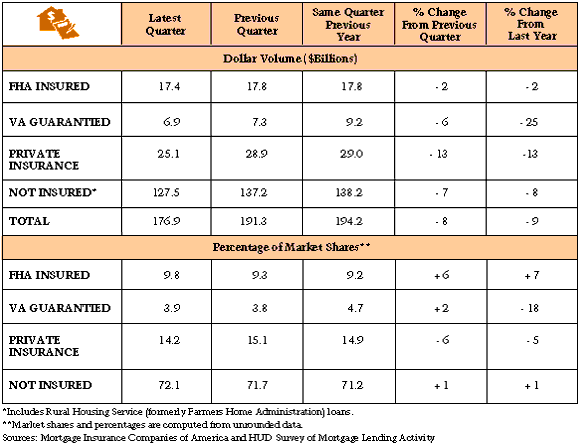
The total value of mortgage originations for 1-4 family homes
was $176.9 billion in the first quarter of 1997, down 8 percent
from the fourth quarter of 1996. Privately insured mortgages decreased
13 percent; uninsured mortgage volume decreased 7 percent; VA-guarantied
mortgages decreased 6 percent; and FHA-insured mortgages decreased
2 percent. The overall decrease from the first quarter of 1996
was 9 percent. VA-guarantied mortgages decreased 25 percent; privately
insured mortgages decreased 13 percent; uninsured mortgages decreased
8 percent; and FHA mortgage volume decreased 2 percent. Market
shares changed to reflect changes in volumes during the first quarter of 1997; however, the changes in market shares never exceeded 1 percentage point.
 Residential Mortgage Originations by Building Type* Residential Mortgage Originations by Building Type*
Residential mortgage originations totalled $186.9 billion in the
first quarter of 1997, down 8 percent from the fourth quarter
of 1996 and 9 percent from the first quarter of 1996 and identical
to the single-family mortgage pattern. The financing volume for
multifamily (5+) units totalled $10.0 billion in the first quarter,
down 21 percent from the previous quarter and 11 percent from
the first quarter of 1996.

 Mortgage Originations by Lender Type, 1-4 Family Units Mortgage Originations by Lender Type, 1-4 Family Units
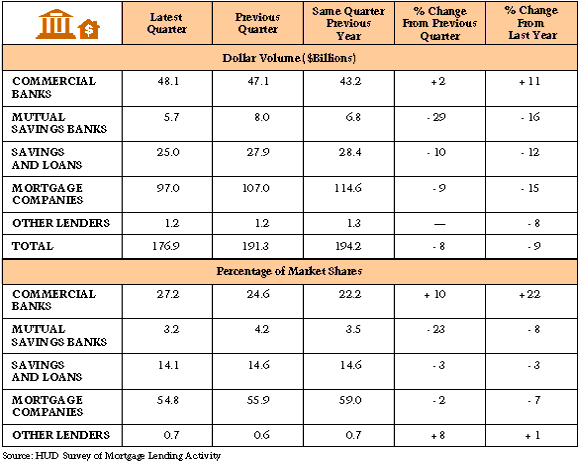
During the first quarter of 1997, commercial banks with a volume
of $48.1 billion and a market share of 27.2 percent showed a 2-percent
increase from the fourth quarter of 1996 and an 11-percent increase
from the first quarter of 1996. Lenders in the other categories
posted declines for the first quarter: Mutual savings banks with
a volume of $5.7 billion and a market share of 3.2 percent declined
29 percent; savings and loans with a volume of $25.0 billion and
a market share of 14.1 percent declined 10 percent; and mortgage
companies with the largest volume, $97 billion, and highest market
share, 54.8 percent, declined 9 percent from the previous quarter.
Other lenders were unchanged from a very small volume and market
share. However, data are based on a newly introduced sample design
that calls into question comparisons of current and previous data.
More data from the newly introduced sample design must be collected
before the series can be used with confidence for time-to-time
comparisons.
 Delinquencies and Foreclosures Delinquencies and Foreclosures
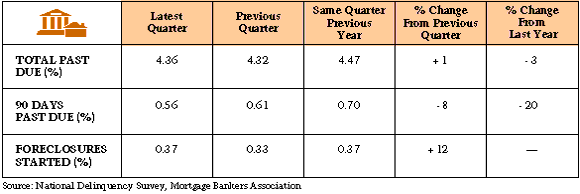
Total delinquencies were at 4.36 percent at the end of 1997's
first quarter, 1 percent above the fourth quarter, but 3 percent
below the first quarter of 1996. Ninety-day delinquencies were
at 0.56 percent, down 8 percent from the fourth quarter of 1996
and down 20 percent from the first quarter of 1996. During the
first quarter of 1997, 0.37 percent of loans entered foreclosures,
12 percent above the previous quarter but the same as the first
quarter of 1996.
HOUSING
INVESTMENT
 Residential Fixed Investment and Gross Domestic Product* Residential Fixed Investment and Gross Domestic Product*
Residential Fixed Investment (RFI) for the second quarter of 1997
was $321.4 billion, 1 percent above the value from the first quarter
of 1997 and up 2 percent from the second quarter of 1996. As a
percentage of the Gross Domestic Product, RFI was 4.0 percent,
unchanged from the previous quarter but down 0.2 percentage point
of the value from a year ago.

HOUSING
INVENTORY
 Housing Stock* Housing Stock*
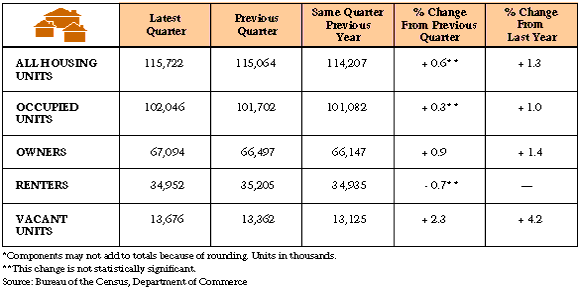
As of the second quarter of 1997, the estimate of the total housing
stock, 115,722,000 units, was a statistically insignificant 0.6
percent above the level of the first quarter of 1997 and 1.3 percent
above 1996's second-quarter level. The number of occupied
units was up a statistically insignificant 0.3 percent from last
quarter and was 1.0 percent above the same quarter in 1996. Owner-occupied
homes were 0.9 percent above the level of the first quarter of
1997 and 1.4 percent above the second quarter of 1996. Rentals
decreased a statistically insignificant 0.7 percent from last
quarter and remained unchanged from the second quarter of 1996.
Vacant units rose 2.3 percent from last quarter and 4.2 percent
from 1996.
 Vacancy Rates Vacancy Rates
The 1997 second-quarter national rental vacancy rate, at 7.9 percent,
was down a statistically insignificant 0.4 percentage point from
last quarter and down a statistically insignificant 0.1 percentage
point from the level of the second quarter of 1996. The homeowner
vacancy rate, at 1.6 percent, was down a statistically insignificant
0.1 percentage point from last quarter but up a statistically
insignificant 0.1 percentage point from the second quarter of
1996.

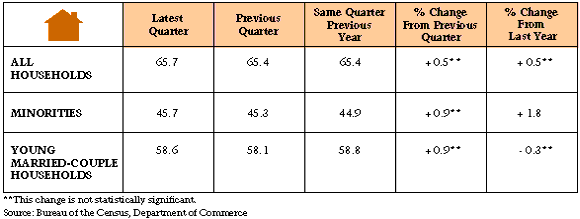
 Homeownership Rates Homeownership Rates
The national homeownership rate was 65.7 percent in the second
quarter of 1997, up 0.3 percentage point from last quarter and
from the second quarter of 1996. The homeownership rate for minority
households increased a statistically insignificant 0.4 percentage
point from the first quarter and increased 0.8 percentage point
from the second quarter of 1996. The 58.6-percent homeownership
rate for young households was up a statistically insignificant
0.5 percentage point from last quarter's rate and down
a statistically insignificant 0.2 percentage point from 1996's
second quarter.
|

