Historical Data

icon

Table 25. Net Change in Number of Households by Type of Household: 1971-Present*

Table
*Units in thousands.
rImplementation of new March CPS processing system.
1Data from 1971 to 1979 weighted based on the 1970 decennial census.
2Data from 1980 to 1992 weighted based on the 1980 decennial census.
3Beginning in 1993 CPS data weighted based on the 1990 decennial census.
4Primary families only.
Source: Current Population Survey, Bureau of the Census
Note: The source of annual data is the Current Population Survey March Supplement. The quarterly data source is the monthly Current Population Survey/Housing Vacancy Survey.


icon

Table 26. Net Change in Number of Households by Race and Ethnicity of Householder: 1971-Present

Table
rImplementation of new March CPS processing system.
1Data from 1971 to 1979 weighted based on the 1970 decennial census.
2Data from 1980 to 1992 weighted based on the 1980 decennial census.
3Beginning in 1993 CPS data weighted based on the 1990 decennial census.
Source: Current Population Survey, Bureau of the Census
Note: The source of annual data is the Current Population Survey March Supplement. The quarterly data source is the monthly Current Population Survey/Housing Vacancy Survey.


icon

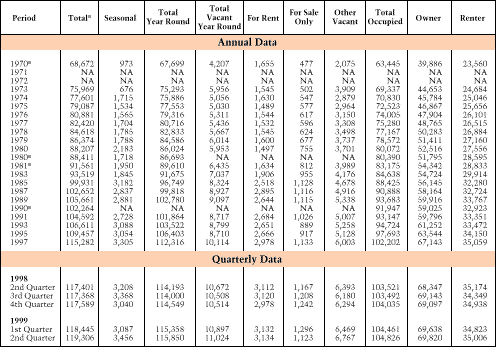
Table 27. Total U.S. Housing Stock: 1970-Present*

Table
*Components may not add to totals because of rounding. Units in thousands.
1Census of Housing 1970.
2Census of Housing 1980.
3American Housing Survey estimates are available in odd-numbered years only after 1981.
4Census of Housing 1990.
5Annual Housing Survey estimates through 1981 based on 1970 Census weights; 1983 to 1989 estimates based on 1980 Census weights; 1991 and 1995 estimates based on 1990 Census weights. No reduction in Nation's housing inventory has ever occurred; apparent reductions are due to changes in bases used for weighting sample data.
Sources: Annual Data -- Annual or American Housing Surveys; Quarterly Data -- Current Population Series/Housing Vacancy Survey in Current Housing Reports: Housing Vacancies and Homeownership, Bureau of the Census, Department of Commerce


icon

Table 28. Rental Vacancy Rates: 1979-Present

Table
Source: Bureau of the Census, Department of Commerce


Tables 29-32

Home | Table of Contents | Summary | National Data
Regional Activity | Historical Data | Subscription Form