
|
Components of Inventory Change How does new housing differ from existing housing? What kinds of units are most likely to leave the stock? Where do they go? Are they demolished, converted to nonresidential use, or destroyed by disasters? How many units are split into multiple units or merged into one? Are the units receiving government subsidies more likely to disappear? These and many similar questions are addressed by a series of reports entitled Components of Inventory Change (CINCH), soon to be issued by the U.S. Department of Housing and Urban Development (HUD). The reports are based on the American Housing Survey (AHS) and were produced by ICF Consulting, Inc., under contract with HUD. There were more than 110 million housing units in the United States in 1997, according to the AHS. These units are a heterogeneous lot, ranging from shacks to mansions. This stock changes over time. The 1995 AHS showed about 1.5 million more total units than 1993. This net change masks the fact that almost 4 million units were added to the stock and about 2.5 million were lost. We know a bit about the characteristics of newly constructed housing from the surveys conducted by the Bureau of the Census and other organizations. However, there are many details about such housing that these surveys do not cover, nor do they address the characteristics of lost or changed units. The CINCH reports are designed to fill those gaps. The national component of the AHS is funded by HUD and conducted by the Bureau of the Census in odd-numbered years. (There is also a metropolitan component of the AHS, but that was not used in the CINCH reports.) The AHS is a sample survey of approximately 50,000 housing units. Census field representatives administer a questionnaire covering the physical housing unit, the equipment installed, the financial characteristics of the unit, the characteristics of the residents, and selected neighborhood characteristics. The data are made available to the public in a variety of formats, including tabular reports and public use microdata. The AHS is a longitudinal survey. After a housing unit is selected for inclusion in the sample, it is surveyed in every subsequent survey year. New units are added to the sample in each survey to account for new construction and (to a lesser extent) conversion from nonresidential use. Thus it is possible to link observations on the same housing unit from one survey year to the next, tracing the changes that the unit and its occupying household undergo. In many cases, of course, the household will not consist of the same people, since the AHS is a survey of housing units and not people per se. The CINCH reports take advantage of the longitudinal feature of the AHS to trace detailed changes in the housing stock from 1985 to 1997. There are six reports covering each of the 2-year intervals between surveys in that period, plus a combined report that covers the decade from 1985 to 1995. These reports will soon be available for download from HUD's World Wide Web site and later as printed documents. Each of the 2-year reports is about 60 pages long, consisting mostly of statistical tables. These tables are detailed answers to two simple questions: "What happened to the housing stock that existed at the beginning of the period?" and "Where did the housing stock that existed at the end of the period come from?" The "What happened?" question is answered in the CINCH reports by rows and columns dealing with losses. These use the beginning of the period as the base year and show the disposition of the units that existed in the base year. Conversely, the "Where did they come from?" question is answered by rows and columns dealing with gains. These use the end of the period as the base year and show the sources of the base-year stock. Additions and losses must be accounted for independently, because each CINCH report is based on a pair of samples. If we had a complete enumeration of the housing stock in each survey year, it would be possible to construct a single, balanced accounting table for all changes. However, the AHS samples at the beginning and end of each period are not identical. Even in a longitudinal survey, the sample changes over time. Some of these changes are caused by real changes in the housing stock, which is what we want to measure. Other changes are caused by refusals from sample households, failure of the field representatives to find addresses, and other kinds of "friction" that any survey encounters. Thus it is not possible to exactly match and identically weight all the cases from one survey to another. The CINCH reports represent the best effort that time and budget permitted. Because the two sets of rows and columns do not use the same base, it is not possible to combine them in a logically rigorous way. However, one can approximate net changes by comparing losses and additions. For example, Table 1 summarizes changes in the 1993-95 period. In an accounting framework, the net change from splits and merges should be the same whether one uses 1993 or 1995 as the base year, but in Table 1 they are slightly different. There are similar (but less visible) differences in each of the changes tracked by CINCH. Subtracting total losses from total additions yields an implied net addition of 1.284 million units, but this is only an approximation because of the differences in base years.
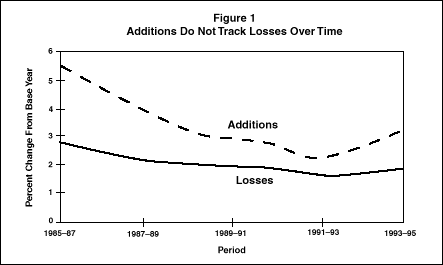
The remainder of this article will look at what the CINCH tables tell us about the dynamics of the housing stock. First we will take a look at general changes in the whole stock. Then we will select a few representative details to give a flavor for the specific questions that CINCH can answer. Most of the numbers will be drawn from 1993-95, at the end of the 10-year period covered by the combined report. We will also look at rates of addition and loss for housing with specific characteristics, averaged over 1985-95. Changes in the Total Stock The first thing to note is that the housing stock changes very slowly. As Table 1 illustrates, the net increase in the housing stock over 1993-95 was only a little more than 1 percent. However, this net change masks gross changes of almost 6 percent.1 The largest sources of losses were demolition and mobile homes moved out.2 The largest source of additions was new construction. Note the "other sources" line, which is substantial for losses. This line represents the limits of our knowledge in survey research. The units included disappeared from the survey (or, with much smaller frequency, appeared in it), but we have been unable to assign them to the other categories. In short, we do not know their dispositions (or sources). The percentage distributions in Table 1 are roughly similar to the ones that can be observed in any of the CINCH reports. However, the levels of additions and losses do not move in parallel. As Figure 1 illustrates, losses are relatively constant at between 2 and 3 percent a year. Additions, on the other hand, fell from about 5.5 in 1985-87 to a low of around 3 percent in 1991-93 before recovering to around 3.5 percent in 1993-95. A possible explanation is that additions, which are almost all new construction, are more sensitive to economic conditions than losses. Losses may be caused more by ordinary decay and natural disaster, which are less variable over time. Of course, it is true that some of these losses can be mitigated by maintenance and repair, both of which probably have an economic component.
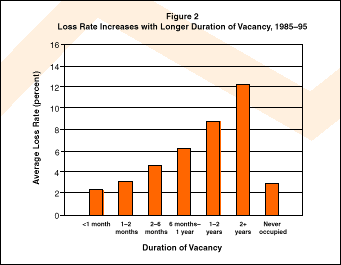
 Tenure and Vacancy While most units vacant at the beginning of each period are occupied by the end, there is a high rate of loss for these units. This loss is balanced by almost the same percentage increase of new vacant units being added to the stock, leaving the pool essentially unchanged. A rather more interesting situation is represented by the "Temporary Loss" row of Table 2.3 These are units that are temporarily uninhabitable, but which are capable of being (literally) rehabilitated. Table 2 shows that an average of about 14 percent of these units are lost to the housing stock over the 2-year periods but that about 12 percent are added.4 These additions include units that are in the survey but are not yet completed. Figure 2 illustrates that the longer a unit remains vacant, the more likely it is to be lost from the stock. Owner-occupied units are half again less likely to be removed from the stock as renter-occupied units and about half again more likely to be added, giving them a net rate of increase that is almost seven times as great.
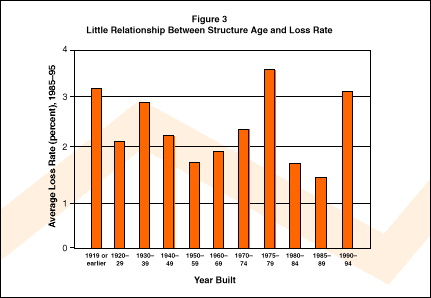
 Age of Structure Surprisingly, there seems to be very little relationship between the age of a structure and the likelihood that it will leave the stock. Figure 3 illustrates this for the 1993-95 period. There is no clear trend, with loss rates fluctuating between 1.5 and 3.5 percent. It is also interesting that on the addition side there are increases in older units, because of conversions from nonresidential structures, splitting units, and mobile homes moved in. These range from about a third of a percent per period for newer units to a few hundredths of 1 percent for the oldest units.
 Unit Size By just about any measure, bigger is better as far as housing preferences are concerned—as illustrated in Table 3. Whether the measurement is square footage, number of rooms, number of bedrooms, or number of bathrooms, larger units have higher addition rates and lower loss rates. Thus we can confidently state that the general size of units is increasing over time.
Unit Quality Any number of measures in the CINCH reports could be used to illustrate that poor quality units disappear at higher rates and that good quality units have higher addition rates. Here we will use just the AHS's recoded measure of adequacy. The AHS defines "moderately inadequate" and "severely inadequate" units based on defects in plumbing, structure, electrical wiring, kitchen equipment, and heating equipment. Table 4 illustrates the dynamics of inadequate units compared with all units. Moderately inadequate units have loss rates nearly twice as high as all units, while severely inadequate units also have high loss rates.
Household Income An important public policy concern is the preservation of the housing stock for low-income households. One of several measures that address this issue in CINCH is the changes in the stock occupied by households below or near the poverty level. The story told by Table 5 is that loss rates for units occupied by households below the poverty level are much higher than for those above it.5 Addition rates are low for units occupied by households with incomes up to almost double the poverty level. Indeed, the absolute loss of these units in 1993-95 was greater than the loss of units occupied by higher income households, even though low-income units represented only about a third of all occupied units in 1993. It is not surprising that such units would have higher loss rates, but this still illustrates the problem faced by HUD and others interested in assuring housing for all.
Assisted Rental Units Another public policy concern is the availability of assisted rental housing units. Table 6 shows that these units are disappearing at a somewhat faster rate than the unassisted rental housing stock.6 Over the 10-year period, the loss rate for unsubsidized units was about 1 percentage point higher than the addition rate, leading to a gradual decline in the rental stock. Units owned by public housing authorities experienced comparable addition and loss rates. Federally subsidized units experienced a somewhat higher difference between loss rates and addition rates, while units receiving State or local subsidies had much higher loss rates. This table must be interpreted with care, however. It shows the additions or losses for units that were subsidized at the end or beginning of the periods, respectively. Federal housing vouchers can be used in any qualifying unit that an assisted household chooses to rent. The loss of a voucher unit does not necessarily mean that the number of subsidized units actually decreases. Rather, it is more likely that the voucher was transferred to another unit. The losses in Table 6 show that units that are being used for housing assistance are more likely to be among those units that leave the stock. Units added to the stock are unlikely to be subsidized.
Conclusion The samples of the kinds of information available in the CINCH reports presented here provide a rare opportunity to observe the changes in America's housing at a level of detail that few other sources can match. The reports show that gross changes in the total stock are about six times greater than the net change. While additions come overwhelmingly from new construction, losses are a combination of demolition, damage, and other factors. Losses are relatively steady over time, but additions rise and fall with economic conditions. The representative housing unit is becoming larger, of better quality, and more likely to be owner occupied. Units occupied by lower-income households are more likely to be lost, and added units are more likely to be occupied by households with incomes more than double the poverty level. These are just some of the trends that can be identified from the CINCH reports.
Notes
Mobile home movements are considered losses and additions because the AHS is unable to track units when they are not located at sampled addresses. Thus, when a mobile home is moved out, it is assumed to be destroyed. To balance this, when existing mobile homes are moved into a sampled site, it is treated as an addition to the stock. Note that any mobile home manufactured during the period covered by a particular CINCH report is counted as new construction, not as "mobile home moved in."
Experienced analysts of AHS data will know these units as "type B noninterview."
The average rates of change in this article are the average 2-year changes over the five periods, as a percentage of the units present in the base year. These changes include the net change from conversions and mergers.
Note that the rates in Table 5 are averaged over 1989-95. This is because income as a percentage of poverty is not available in the 1985 and 1987 AHS.
This table omits some minor categories of assisted units that are reported in the AHS and the CINCH
reports. These include units whose households report income for purposes of setting rents and those that report some "other" form of subsidy. |