Housing production and sales continued at a strong pace in the third quarter of 1997. All the relevant measures revealed high levels of activity, and all geographical regions reported strong or improving housing markets, even regions that had previously lagged behind. The favorable conditions of recent years culminated in the third quarter with the attainment of an all-time high homeownership rate of 66.0 percent, breaking a 17-year-old record. Housing production in the third quarter compared favorably with high levels from 1996:
Marketing of housing in the third quarter continued at very high levels for conventionally built and existing homes, while placements of manufactured homes declined:
Low interest rates, favorable housing affordability, and a strong economy have led to an all-time record high quarterly homeownership rate. Commitment interest rates for conventional, fixed-rate, 30-year loans averaged 7.47 percent in the third quarter, down 23 basis points from the second quarter. Affordability, an index that combines the interest rate, median home price, and family incomes, was slightly ahead of last quarter, with a family earning the median income having 126.6 percent of the income needed to purchase a median-priced existing home. The U.S. homeownership rate reached a historic high of 66.0 percent in the third quarter, 0.3 percentage point* ahead of the second-quarter rate. Homeownership has increased or remained stable in 12 of the past 13 quarters, reversing the decline that occurred from 1980 to 1985. The picture for multifamily housing (5+ units) was mixed during the third quarter, with permits up slightly, absorptions up, vacancies unchanged, and starts down:
*This change is not statistically significant. Regional PerspectiveHUD's field economists reported that job market conditions remained favorable through the third quarter of 1997. All regions reported employment growth, ranging from slow improvement in the New York/New Jersey region to the highest improvement of the 1990s in the Mid-Atlantic region. The Pacific region rebounded sharply, reflecting the improvement in California, and the Northwest region continued to benefit from the activity in aerospace and high-technology industries. Homebuilding, as measured by single-family building permit activity, was down modestly throughout much of the Nation. The New York/New Jersey and Pacific regions were the only regions to record increases during the first three quarters of 1997. Sales of both new and existing homes, however, have remained very strong. The Washington, D.C., metropolitan area is expected to have the best year for home sales of the 1990s. The Midwest region should have one of the best years of the past 15 years. Denver area existing home sales are poised to set a record in 1997. Sales housing markets in Orange County, San Diego, and the San Francisco Bay Area had large production increases during the first three quarters of the year. Las Vegas remains a very strong market, and Phoenix may set another record in 1997. Rental housing market conditions remained strong throughout the country. New England is on track to have its most productive year for apartment construction since 1990, particularly in the Boston area and in southern New Hampshire. Manhattan's rental market is very tight, although almost 8,000 new rental units will be completed in 1998 and 1999. More than 78,465 multifamily units were permitted in the Southeast during the first 9 months of 1997. Construction was up significantly in almost every major market in Florida, where strong demand attracted large amounts of investment capital. Midwest rental housing markets reported apartment occupancy in the 93- to 96-percent range, and construction activity continued at a healthy pace. The Southwest apartment boom continued, with all States reporting increased building permit activity during the first 9 months of 1997. Texas recorded the largest percentage increase, 40 percent, with more than 32,700 units. The Dallas-Fort Worth area led the way with a 57-percent increase and what may prove to be the best year of the 1990s. In the Rocky Mountain region, Denver may also have its best year of the 1990s. Multifamily housing permit activity in California was up 39 percent. Seattle is expected to match or slightly exceed last year's level, but apartment production is still below the level needed to meet projected demand. THE 1996 HMDA DATA:
|
Table 1. Manufactured Home and B&C Conventional Home Purchase Applications from 1993 to 1996 |
Mortgage rejection rates for manufactured home and B&C loans are much higher than the mortgage rejection rate for prime loans. In 1996 the 55.1-percent rejection rate for manufactured home loan applications and the 54.2-percent rejection rate for B&C loan applications were more than four times the 12.7-percent rejection rate for conventional prime loan applications and more than five times the 10.0-percent rejection rate for Federal Housing Administration (FHA) loan applications.
Table 2 reports the 1996 rejection rates for manufactured home, B&C, conventional prime, and FHA loans by racial and ethnic group. After controlling for manufactured home and B&C loan applications, the rejection rate for conventional applications for all racial and ethnic groups fell dramatically. The rejection rate for black applications fell from 48.7 percent to 25.3 percent; the rejection rate for Hispanic applications fell from 34.4 percent to 19.6 percent; and the rejection rate for white applications fell from 24.1 percent to 10.9 percent.
The differential in rejection rates between minority and white applicants is highest for black borrowers for all loan products. The differential between the black and white rejection rates is 16.1 percentage points for manufactured home loan applications; 11.1 percentage points for B&C loan applications; 14.4 percentage points for conventional prime loan applications; and 7.1 percentage points for FHA loan applications.
After controlling for manufactured home and B&C loan applications, the trend in conventional prime rejection rates becomes clearer. Rejection rates for all racial and ethnic groups are at their 1993 levels after a 2-year period of moderately lower rates. For example, the conventional prime loan rejection rate for black borrowers was 24.9 percent in 1993 and 25.3 percent in 1996; the rejection rate for Hispanic borrowers was 21.4 percent in 1993 and 19.6 percent in 1996; and the rejection rate for white borrowers was 10.9 percent in both 1993 and 1996.
Table 2. 1996 Denial Rates by Racial and Ethnic Group |
Table 3. Share of Originations by Loan Product and Borrower and Neighborhood Characteristics ![]() 1For example, 22.9 percent of all loans originated for American Indians are manufactured home loans. |
Manufactured home loans, B&C loans, and FHA loans are important sources of affordable lending for minority and low-income borrowers and their neighborhoods. These markets serve borrowers that do not meet the underwriting standards of the conventional prime market. In 1996 manufactured home, B&C, and FHA loans combined accounted for 29.6 percent of all home purchase loans. Manufactured home and B&C loans accounted for 8.7 percent and 2.7 percent of home purchase loans, respectively, and FHA accounted for 18.2 percent of home purchase loans. Table 3 reports the shares of 1996 originations by loan product and borrower and neighborhood characteristics.
Borrower Race. Black borrowers rely more on manufactured home and B&C loans than Hispanic or white borrowers. Black borrowers are 1.3 times more likely to have a manufactured home loan and 2.0 times more likely to have a B&C loan than white borrowers. Hispanic borrowers are 0.7 times less likely to have a manufactured home loan and 1.4 times more likely to have a B&C loan than white borrowers.
Blacks and Hispanics rely heavily on FHA loans, which account for 38.2 percent of black loans and 42.0 percent of Hispanic loans. The combined share of manufactured home, B&C, and FHA loans is 54.5 percent for black borrowers and 51.3 percent for Hispanic borrowers. The conventional prime market provides less than 50.0 percent of home purchase loans to black borrowers and to Hispanic borrowers.
Borrower Income. Low-income borrowers are more likely to have a manufactured home than moderate- or high-income borrowers;8 they are 4 times more likely to have a manufactured home loan than high-income borrowers. The share of loans accounted for by B&C loans does not vary significantly by borrower income. B&C loans account for between 2 and 3 percent of loans originated for low-, moderate-, and high-income borrowers. This result may be indicative of the sample of B&C lenders that report under HMDA. However, there is evidence that B&C loans are originated primarily for borrowers with impaired credit histories, independent of their income level.9
Neighborhood Characteristics. Manufactured home, B&C, and FHA loans account for a larger share of loans for properties located in low-income and minority neighborhoods.10 A borrower in a low-income neighborhood is 3.3 times as likely to have a manufactured home loan, 1.8 times as likely to have a B&C loan, and 2.4 times as likely to have an FHA loan than a borrower in a high-income neighborhood. Manufactured home loans account for 8.6 percent, B&C loans account for 3.8 percent, and FHA loans account for 30.2 percent of loans originated in low-income neighborhoods. A borrower in a minority neighborhood is 1.1 times as likely to have a manufactured home loan, 1.9 times as likely to have a B&C loan, and 1.8 times as likely to have an FHA loan than a borrower in a nonminority neighborhood. Manufactured home loans account for 6.3 percent, B&C loans account for 4.0 percent, and FHA loans account for 32.0 percent of loans originated in minority neighborhoods.
Manufactured home loans, B&C loans, and FHA loans are important sources of affordable lending for minority and low-income borrowers and their neighborhoods. These markets serve borrowers that, for the most part, do not meet the underwriting standards of the conventional prime market. Analyses of HMDA data that recognize the importance of manufactured home, B&C, and FHA loans in affordable lending lead to more focused understanding of mortgage market trends and more focused policy implications for increasing homeownership. The main points of these analyses are:
1 Subprime loans include a mix of loans, most of which are characterized by imperfection in the borrower's credit or have terms that do not meet the conforming underwriting standards of Fannie Mae or Freddie Mac. For a more complete discussion of the role of manufactured home and B&C applications in HMDA, see Scheessele, Randall M., 1997, "The Impact of Manufactured Home and Subprime Loans on HMDA Rejection and Origination Rates," working paper, Department of Housing and Urban Development, November.
2 HMDA data are the most comprehensive source of annual information on primary mortgage market originations and secondary market loan purchases. For a good overview of the limitations of HMDA data, see Bunce, Harold L. and Randall M. Scheessele, 1996, "The GSEs' Funding of Affordable Loans," Working Paper Series HF-001, Department of Housing and Urban Development, December.
3 For example, Greentree Financial Corporation and Bank of America, FSB, are the largest manufactured home lenders that report home purchase applications under HMDA. Ford Consumer Finance Company and Access Financial Lending Corporation are the largest B&C lenders that report home purchase applications under HMDA.
4 For example, Countrywide Funding Corporation, The Chase Manhattan Bank, and Norwest have entered the B&C market.
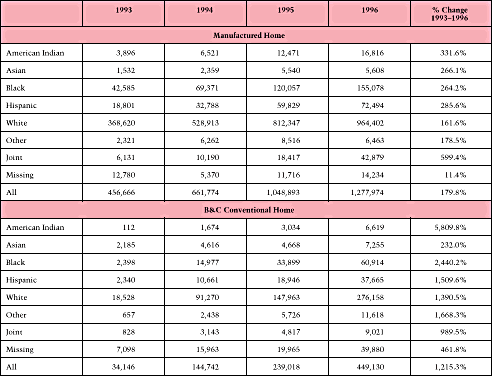
5 The B&C share would be higher if refinance applications were included because refinance loans comprise the majority of B&C lender activity. Martin Wahl and Craig Focardi (1997, "The Stampede to Subprime," Mortgage Banking October: 26-36) estimate that there were $90 billion in B&C loans in 1996. The HMDA data report approximately $25 billion for loans originated by lenders that specialize in B&C lending. Possible explanations for the difference between HMDA and Wahl and Focardi's estimate are that Wahl and Focardi's number may include loans that are not reported under HMDA; the HMDA number does not include B&C loans originated by prime lenders; and not all B&C lenders report under HMDA.
6 See Wahl and Focardi (1997).
7 See Harvard University Joint Center for Housing Studies, 1997, The State of the Nation's Housing 1997; and Fields, Ruth G., 1996, "The Mortgage Sleeper is Waking Up in Manufactured Homes," Secondary Marketing Executive October: 32-39.
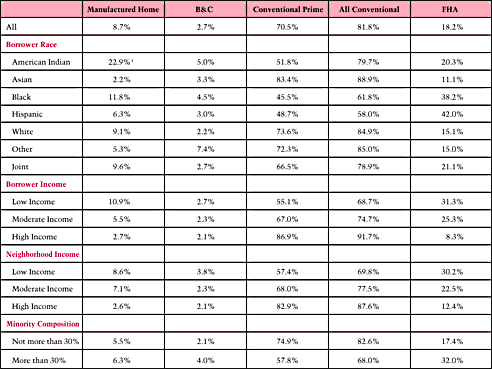
8 A low-income borrower has an income that is no more than 80 percent of area HUD median family income. Moderate income is defined as between 80 and 120 percent of area HUD median family income, and high income is defined as more than 120 percent of area HUD median family income.
9 For example, see "Low to Moderate Income and High Minority Area Case Studies," Fair Isaac and Company, Inc, discussion paper (October 4, 1996).
10 A low-income neighborhood is a neighborhood where tract median family income is no more than 80 percent of area median family income. Moderate income is defined as between 80 and 120 percent of area median income, and high income is defined as more than 120 percent of area median family income. A minority neighborhood is a tract where minorities comprise more than 30 percent of the tract population.