
|
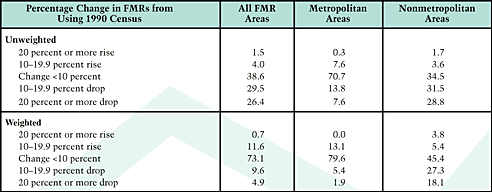
Research on Fair Market Rents The February 1999 issue of U.S. Housing Market Conditions defined Fair Market Rents (FMRs), explained how they determine the level of benefits available to families participating in the certificate and voucher program, and described how HUD calculates FMRs for 2,736 distinct areas annually. This issue reports research that HUD has conducted on FMRs. Four topics are covered: the accuracy of FMR estimates, the adequacy of FMRs within subareas of metropolitan FMR areas, the impact of specific elements in the FMR standard on the level of benefits provided, and the effect of the increased flexibility given by the Quality Housing and Work Opportunity Act of 1998 to local housing authorities and HUD to alter FMRs.1 How Accurate Are FMRs? Once each decade -- at the time HUD incorporates the latest decennial census into its calculation of FMRs -- HUD has the opportunity to see how much error has accumulated over the past decade in individual FMRs.2 The top panel of Table 1 shows the effects of the 1990 census on the 1994 FMRs -- the first year in which FMRs were no longer based on the 1980 census. The results indicate that the accumulated error was both substantial and negative: 55 percent of FMR areas showed a drop of 10 percent or more, 6 percent showed an increase of more than 10 percent, and only 39 percent were within 10 percent of the census numbers. The factors used during the decade to update FMRs had resulted in substantial overestimates of the FMRs. The error was particularly serious among the non-metropolitan FMR areas, where fully 60 percent had been overstated by more than 10 percent (compared with only 21 percent of the metropolitan FMR areas). This reflects two problems. First, prior to fiscal year 1994, HUD set FMR rents in nonmetropolitan areas by county groups rather than individual counties. These groups typically consisted of several counties, but often the FMR calculation was dominated by a single county in the group. As a result, when HUD shifted to individual counties in FY 1994, the county group FMRs were frequently substantially different from the FMRs in the individual counties. Second, in the 1980s accurate data on local rent trends among the nonmetropolitan areas during the decade were not available; the only updating that occurred had been based on Consumer Price Index (CPI) data that divided the Nation into only four regions and did not distinguish between metropolitan and nonmetropolitan parts of those regions. By contrast, many metropolitan FMR areas had been updated since the 1980 census using annual CPI surveys of the metropolitan area or several metropolitan areas combined. For the largest metropolitan areas, there had been at least one rebenchmarking of the FMR from an American Housing Survey during the decade. Because FMR areas vary widely in size, a better measure of the importance of the accumulated errors is found by weighting the percentage errors by the number of rental units in each area. By this measure the errors were not nearly as serious, although nonmetropolitan FMR areas still account for a disproportionate share of serious errors. The bottom panel of Table 1 shows that in nonmetropolitan areas, 45 percent of the rental stock was within 10 percent of being correct, compared with about 80 percent of the metropolitan rental stock. Far more nonmetropolitan markets (45 percent) faced decreases of more than 10 percent than metropolitan markets (7 percent). Although one would expect errors to be greatest at the end of a decade of updating, HUD has taken major steps to reduce errors in the 1990s. The Department now uses Random Digit Dialing (RDD) surveys to provide finer detail on rent inflation by region, to spot-check areas where other information suggests that FMRs may be inaccurate, and to routinely update the FMR baseline for metropolitan areas that have large certificate and voucher programs. The RDD surveys used for routine updating also provide a more current picture of the accuracy of FMRs for larger metropolitan areas. Over the past 3 years, HUD has conducted 80 routine update RDD surveys.3 Of these, 39 resulted in no changes, 18 led to increases in the FMR, and 23 led to decreases in the FMR. These results suggest that accurate updating of FMRs is still a challenge but has improved greatly since the 1980s. Of the 41 changes, only 9 were equal to or greater than 10 percent. In other words, 88 percent of the FMRs were within 10 percent of the right level. The current approach appears to be generally unbiased, with approximately equal number of increases (18) and decreases (23).
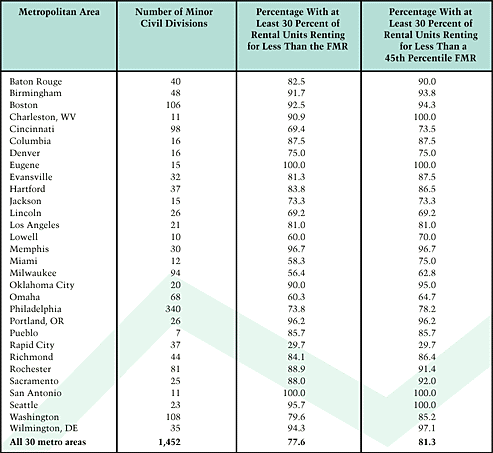
Table 1. Effect of 1990 Census on 1994 FMRs  FMRs and Small Areas A frequent criticism of FMRs in metropolitan areas is that an FMR that covers an entire metropolitan area will be too high in some parts of the metropolitan area (usually the central city) and too low in other parts (usually affluent suburbs). Although average rents vary throughout a metropolitan area, the important question from the perspective of whether the certificate and voucher programs are workable is whether the distributions of rents overlap enough to permit certificate and voucher holders to find units throughout the metropolitan area. HUD analysis indicates that units are generally available to certificate and voucher holders throughout a metropolitan area. Table 2 lists 30 metropolitan areas where HUD studied the availability of rental units to Section 8 certificate and voucher holders at the minor civil division level. (In compiling data from decennial censuses, the U.S. Bureau of the Census reports separately for local governments and for areas recognized locally as distinct geographical entities; the number and size of these minor civil divisions vary from metropolitan area to metropolitan area.) Column 2 counts the number of minor civil divisions in each metropolitan area. Column 3 reports the percentage of these minor civil divisions in which at least 30 percent of the two-bedroom rental units rented in 1990 for less than the metropolitan 1990 equivalent of the FMR as currently defined (that is, at the 40th percentile).4 Column 4 provides the same information as column 3 for FMRs defined at the 45th percentile. Overall, an adequate number of rental units affordable at the FMR are available in 75 percent of the minor civil divisions. In only three metropolitan areas did the percentage of minor civil divisions fall below 60 percent and in only one case (Rapid City, South Dakota) did the percentage fall below 50 percent.
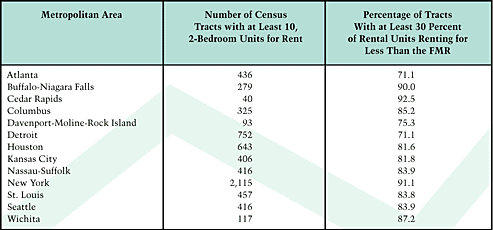
Table 2. Availability of Rental Units in Minor Civil Divisions  Table 3 lists 13 metropolitan areas where HUD studied the availability of rental units to Section 8 certificate and voucher holders at the census tract level. Column 2 counts the number of census tracts with at least 10, 2-bedroom rental units with cash rents. Column 3 reports the percentage of these census tracts in which at least 30 percent of the 2-bedroom rental units rented in 1990 for less than the metropolitan 1990 equivalent of the FMR as currently defined (that is, at the 40th percentile). In every metropolitan area, at least 70 percent of the census tracts with some rental activity had at least 30 percent of their two-bedroom rental units renting for less than the FMR.
Table 3. Availability of Rental Units in Census Tracts  Effect of Choice of Percentile, Recent Movers, Etc. The FMR definition contains several elements. Changing any one of these elements will change the FMR and, in turn, the level of benefits received by certificate and voucher holders. For example, in 1995 HUD changed the definition from the 45th to the 40th percentile. As a result, the average FMR was reduced by $13. By definition, the percentage of units available to program participants in each FMR area declined by 5 percentage points. The effect of this change on the dollar value of the FMR varied across areas, with an average reduction of 3.5 percent and with most of the reductions in the 3- or 4-percent range. An important concern at the time was how the change from the 45th to the 40th percentile would affect the ability of certificate and voucher holders to find units throughout metropolitan areas. Table 2 shows only minor effects in the 30 metropolitan areas studied on the number of minor civil divisions in which at least 30 percent of the 2-bedroom units rent for less than the FMR. The percentage declined from 81.3 percent to 77.6 percent over all 30 metropolitan areas. The FMR standard uses the 40th percentile of rents for units occupied by recent movers because these rents are considered more representative of units available to certificate and voucher holders. Because of this and other adjustments, many more than 40 percent of all rental units have gross rents less than or equal to the FMR. Approximately 41 percent of program participants use certificates and vouchers to rent the unit they occupy prior to entering the program. In these cases, the relationship between the FMR and the overall distribution of rents is more relevant. Data from a special extract of the 1990 census can be used to measure the effect of using recent movers and making other adjustments. The special extract contains information on gross rents for all units and for those units occupied by recent movers -- namely, those occupied within the past 15 months. In accordance with the FMR standard, the extract eliminates units constructed within the 2 years prior to the census and units with severe deficiencies, such as incomplete plumbing or kitchen facilities. In Table 4, FY 1999 FMRs are converted into 1990 dollars using the same rent inflation indices that were used to update FMRs and are compared with the distribution of gross rents for all units in the special extract for 20 metropolitan areas. Strictly speaking, this comparison does not isolate only the effect of using recent-mover rents. The FMRs contain additional quality adjustments and an adjustment to eliminate the effect of having public housing units in the distribution. Table 4 shows that the combined effect of using recent-mover rents and these other adjustments is to make between 45 percent and 70 percent of all rental units available to certificate and voucher holders depending upon location. Averaging over all metropolitan areas, 51.4 percent of rental units have rents less than the FMR; the comparable figure for non-metropolitan areas is 50.2 percent. The average for all FMR areas is 51.2 percent.
Table 4. Percentage of All Units Affordable at the FMR  HUD sets State minimum FMRs for nonmetropolitan areas.5 In FY 1999, 72 percent of all nonmetropolitan counties have FMRs higher than they would otherwise have because of the State minimums. In FY 1996, when HUD first used State minimums, the average increase was $43 or 13.5 percent. Of the nonmetropolitan counties that benefited, 15 percent had their FMR rents raised by less than 5 percent, 47 percent had their FMRs raised between 5 and 15 percent, and 38 percent had their FMR rents raised by more than 15 percent. The Quality Housing and Work Opportunity Act of 1998 The Quality Housing and Work Opportunity Act of 1998 allows individual housing authorities to operate their Section 8 programs with a payment standard that differs from the FMR by up to 10 percent in either direction. Table 5 shows the effect of this flexibility by calculating what the effective FMR percentile would be if a locality chose to use the full flexibility. For example, if all the housing authorities in the Buffalo-Niagara Falls metropolitan area chose to use a payment standard 10 percent higher than the FMR, the effect would be the same as if HUD had set the FMR at the 55th percentile of rents charged to recent movers instead of the 40th percentile. In all 10 areas studied, full use of this authority would alter substantially the character of the Section 8 program. In every case, setting the payment standard 10 percent higher than the FMR would be equivalent to raising the FMR standard above the 50th percentile and, in six cases, would be equivalent to raising the FMR standard above the 55th percentile. Similarly, setting the payment standard 10 percent lower than the FMR would be equivalent to reducing the FMR standard below the 30th percentile.
Table 5. Impact of 10-Percent Variation in FMR  The 1998 act also gives HUD authority to grant exceptions to FMRs exceeding the 20-percent limits previously imposed by the statute.6 Using data from the 1990 census, HUD examined all metropolitan areas to determine how many counties have rent distributions with median rents more than 20 percent higher than the overall metropolitan median. Of 347 metropolitan areas, only 16 had counties with medians more than 20 percent higher than the metropolitan median and, of these, only 3 had counties with medians more than 30 percent higher. At least at the county level, there appear to be only limited opportunities to use this wider authority.
Notes
The 1990 census data became available in 1992 and were used for the first time in setting the FY 1994 FMRs. FMRs from FY 1984 through FY 1993 were based on 1980 census data and other sources. Some judgment was required in separating routine updates from spot-checks. In preparing the list of sites for RDD surveys, HUD starts by identifying places where it believes FMRs may be too low or too high. It then completes the list by adding places based on the size of certificate and voucher programs and the length of time since the last update. The spot-checks contain some areas that might have been routinely updated. This analysis uses all rents, not just recent-mover rents, for two reasons. First, and most importantly, tenants can rent the unit they are currently occupying. Eligibility of these units requires examination of current rents, not turnover rents. Second, the analysis in Table 4 would not have been possible using only recent-mover rents because many tracts would not have had enough 2-bedroom units to analyze. The February 1999 issue of U.S. Housing Market Conditions describes the technique HUD uses to set state minimums. The February 1999 issue of U.S. Housing Market Conditions discusses exception rents.
|